A/B Test Statistical Significance Explained
Learn how A/B test significance works for conversion rates, including absolute and relative lift, p-values, confidence levels, sample size, and common mistakes.
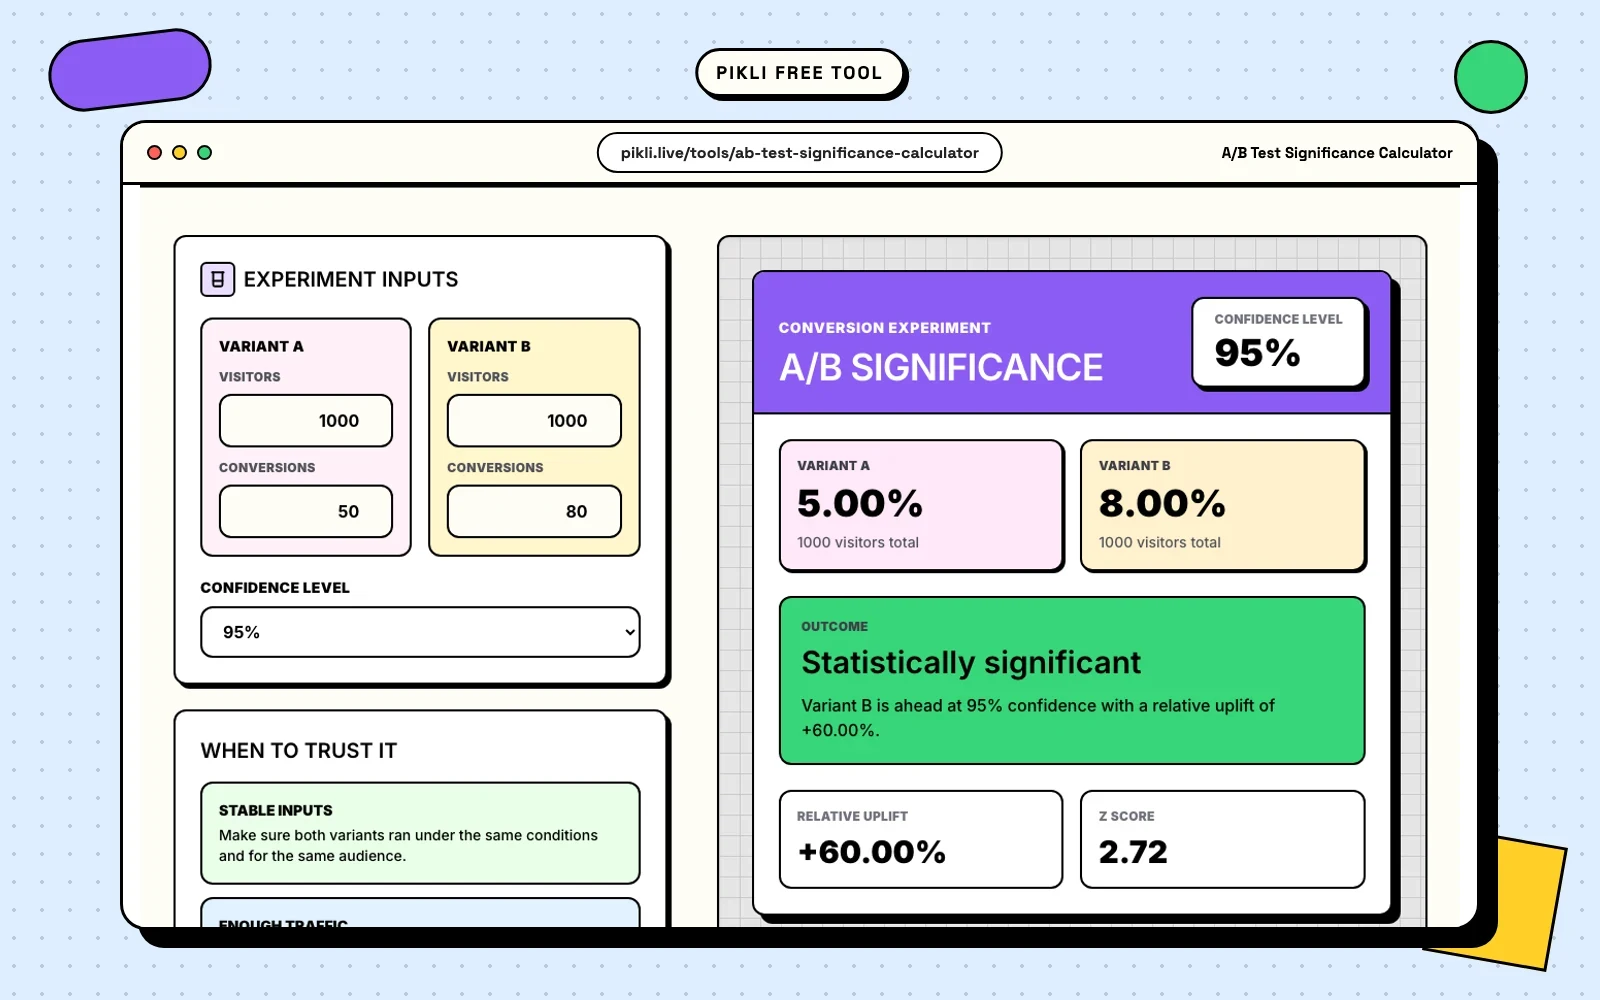
Variant B has a higher conversion rate than variant A. That does not yet make B the winner.
Every experiment contains random variation. Statistical significance asks whether the observed difference would be unusual if the variants had the same underlying conversion rate. It does not tell you that the design was unbiased, the result is commercially important, or the effect will last.
This guide explains a common case: two independently randomized variants with a binary outcome, such as converted or did not convert.
Start with the four input counts
For each variant, record:
- number of eligible visitors or participants;
- number of conversions.
The conversion rate is:
conversion rate = conversions / visitors
Suppose an experiment produces these results:
| Variant | Visitors | Conversions | Conversion rate |
|---|---|---|---|
| A | 2,000 | 120 | 6.0% |
| B | 2,000 | 150 | 7.5% |
Variant B is ahead. The next step is to describe the size of the difference correctly.
Absolute lift versus relative lift
The absolute lift is the difference between the two conversion rates:
7.5% - 6.0% = 1.5 percentage points
The relative lift compares that difference with the control rate:
(7.5% - 6.0%) / 6.0% = 25%
Both numbers are valid, but they answer different questions. “Up 25%” sounds larger than “up 1.5 percentage points,” even though they describe the same result.
Report both. The absolute difference helps teams estimate real outcomes. If 100,000 future visitors behave similarly, 1.5 percentage points would correspond to roughly 1,500 additional conversions before considering uncertainty or implementation effects.
What the two-proportion z-test checks
A common significance test for large independent samples compares two binomial proportions.
The null hypothesis is:
H0: conversion rate A = conversion rate B
The alternative for a two-sided test is:
H1: conversion rate A ≠ conversion rate B
The test pools the observed conversions to estimate a shared rate under the null hypothesis. It then compares the observed rate difference with the standard error expected from sampling variation.
NIST documents the difference-of-proportions hypothesis test, including the pooled estimate and z statistic used for a large-sample comparison.
The free A/B Test Significance Calculator runs this two-proportion z-test and reports the conversion rates, relative lift, z score, and whether the chosen confidence threshold is reached.
Confidence level and significance threshold
A 95% confidence setting normally uses a significance level of:
alpha = 1 - 0.95 = 0.05
For a two-sided test, the result is called statistically significant when the p-value is below 0.05.
Common settings are:
| Confidence level | Significance level |
|---|---|
| 90% | 0.10 |
| 95% | 0.05 |
| 99% | 0.01 |
Choose the threshold before reading the result. Changing from 95% to 90% because the experiment “almost won” increases the risk of calling random variation a real effect.
What a p-value means
The p-value is the probability of seeing a difference at least as extreme as the observed one, assuming the null hypothesis and the test assumptions are true.
It is not:
- the probability that variant B is better;
- the probability that the null hypothesis is true;
- the expected size of the effect;
- the chance that the result will replicate;
- a measure of business value.
A small p-value is evidence against the equal-rate model. It does not repair biased traffic allocation, broken tracking, repeated observations from the same person, or a decision rule invented after the data arrived.
Reading the worked example
In the example, A converts at 6.0% and B at 7.5%. The absolute difference is 1.5 percentage points and the relative lift is 25%.
The approximate two-sided z-test gives a z score near 1.89 and a p-value near 0.059. That misses a preselected 95% threshold, although it would cross a 90% threshold.
The correct 95% conclusion is not “B has no effect.” It is:
B had a 7.5% observed conversion rate versus 6.0% for A, a 1.5-point absolute lift. The two-sided test did not reach the preselected 95% significance threshold.
The data are compatible with several effect sizes. More information may narrow the uncertainty, but extending the experiment only because the p-value is close can invalidate a naive fixed-horizon test.
Statistical significance versus practical significance
A huge sample can make a tiny difference statistically significant. A small sample can leave a valuable difference uncertain.
Before launching the test, define a minimum detectable effect or a minimum practically important effect. This is the smallest improvement worth acting on after accounting for development cost, risk, margin, retention, and operational impact.
Examples:
- A 0.1-point checkout improvement may be valuable at very high traffic.
- A 5% relative click lift may be irrelevant if clicks do not improve revenue or qualified demand.
- A sign-up increase may be harmful if cancellations or support costs rise later.
The decision needs the effect estimate, its uncertainty, and the downstream metric—not only a significance badge.
Plan sample size before the experiment
Sample-size planning connects four ideas:
- baseline conversion rate;
- effect size worth detecting;
- significance level;
- statistical power.
Power is the probability that the planned test detects an effect of the specified size when that effect is real. A common target is 80% or 90%, but the appropriate choice depends on the cost of missing a useful change.
NIST’s sample-size guidance for testing proportions shows how significance, power, baseline proportion, and target difference determine the required sample.
Do not set the duration from calendar preference alone. Estimate the eligible traffic needed, then allow enough full business cycles to cover weekday, weekend, campaign, and seasonality patterns relevant to the product.
Do not stop the first time significance appears
Checking a fixed-horizon p-value every hour and stopping at the first value below 0.05 increases the false-positive rate. Each look creates another opportunity for ordinary noise to cross the threshold.
Use one of these approaches:
- set the sample size and analysis time in advance;
- use a properly designed sequential test with its own stopping boundaries;
- use an experimentation platform whose statistical method explicitly supports continuous monitoring.
“Wait until green” is not a stopping rule.
Check randomization and data quality
Statistical calculations assume the observations represent the intended randomized experiment. Before interpreting the p-value, check:
Sample ratio
If traffic was meant to split 50/50, a large unexplained imbalance can indicate assignment, logging, eligibility, or bot-filtering problems.
Unit of randomization
If users are randomized but page views are analyzed as independent observations, repeat visitors can be counted several times. The analysis unit should match the randomization unit or account for the dependence.
Exposure
Include people according to the experiment’s eligibility and exposure rule. Excluding users after assignment because they behaved inconveniently can bias the comparison.
Metric definition
Use the same conversion window, attribution rule, deduplication, and eligibility filters for both variants.
Novelty and interference
An effect may fade as users adapt. One user’s treatment can also affect another user’s outcome in marketplaces, social products, teams, and shared accounts.
One-sided or two-sided?
A two-sided test checks for a difference in either direction. It is the safer default when a variant can help or harm.
A one-sided test can be appropriate when the direction is chosen before the experiment and an effect in the opposite direction would lead to the same operational response. It should not be selected after B appears ahead.
If a harmful change matters, the analysis must be able to detect it.
Multiple variants and multiple metrics
Every extra comparison creates another chance to find an apparently significant result by luck.
If the experiment has four variants, ten segments, and twelve metrics, searching every combination for p < 0.05 does not preserve a 5% overall false-positive risk.
Predefine:
- one primary decision metric;
- the main comparison;
- guardrail metrics;
- planned segments;
- the correction or hierarchical method for multiple tests.
Treat unplanned findings as hypotheses for a follow-up experiment.
When this calculator is not the right method
The simple two-proportion z-test is not enough when:
- the outcome is continuous, such as revenue per user;
- conversions are extremely rare or counts are very small;
- the same user contributes several correlated observations;
- assignment occurs by store, classroom, company, or geographic cluster;
- traffic changes treatment during the experiment;
- the design uses sequential or adaptive allocation;
- more than two variants require controlled multiple comparisons;
- covariate adjustment is part of the preplanned analysis.
These designs need a method that matches their sampling and randomization structure.
A clear A/B test report
Use a compact report that preserves the decision context:
Variant A converted 120 of 2,000 eligible visitors (6.0%). Variant B converted 150 of 2,000 (7.5%). The observed lift was 1.5 percentage points, or 25% relative. A preplanned two-sided two-proportion z-test produced p≈0.059, so the result did not reach the 95% significance threshold. The experiment used user-level randomization and the prespecified conversion window.
Then add:
- the confidence interval for the absolute effect;
- the planned minimum effect;
- guardrail results;
- data-quality checks;
- the exact stopping rule;
- the product decision.
Final checklist
Before declaring a winner, confirm:
- Was the hypothesis written before the result?
- Were visitors randomized into independent variants?
- Is the analysis unit correct?
- Are conversions deduplicated consistently?
- Was the sample size or stopping method planned?
- Is the confidence threshold unchanged?
- Were repeated looks handled correctly?
- Are multiple metrics and variants controlled?
- Is the absolute effect large enough to matter?
- Are guardrail metrics acceptable?
Use the A/B Test Significance Calculator for a quick two-variant conversion check. Treat its result as one part of the experiment review, not as an automatic shipping decision.
Free to use on Pikli
Check whether your A/B test result is significant
Compare two conversion rates and review the observed lift before you decide.
Ready to discuss the result with your team? Start free with Pikli .
Continue exploring
Related guides
Go deeper with practical articles selected from the same topic cluster.
How to Analyze Likert Scale Data
Analyze 5-point or 7-point Likert data with distributions, medians, means, top-box scores, reverse coding, reliability checks, and clear reporting.
Read article → 02Survey Response Rate vs Completion Rate
Compare survey response rate and completion rate, calculate both with the right denominators, diagnose drop-off, and report the funnel clearly.
Read article → 03How to Calculate Survey Sample Size
Calculate survey sample size from population, confidence level, margin of error, and expected response rate, with formulas and worked examples.
Read article → 04NPS vs CSAT vs CES: Which Metric Should You Use?
Compare NPS, CSAT, and CES formulas, timing, use cases, and limitations. Learn which customer experience metric fits each feedback moment.
Read article →