How to Analyze Likert Scale Data
Analyze 5-point or 7-point Likert data with distributions, medians, means, top-box scores, reverse coding, reliability checks, and clear reporting.
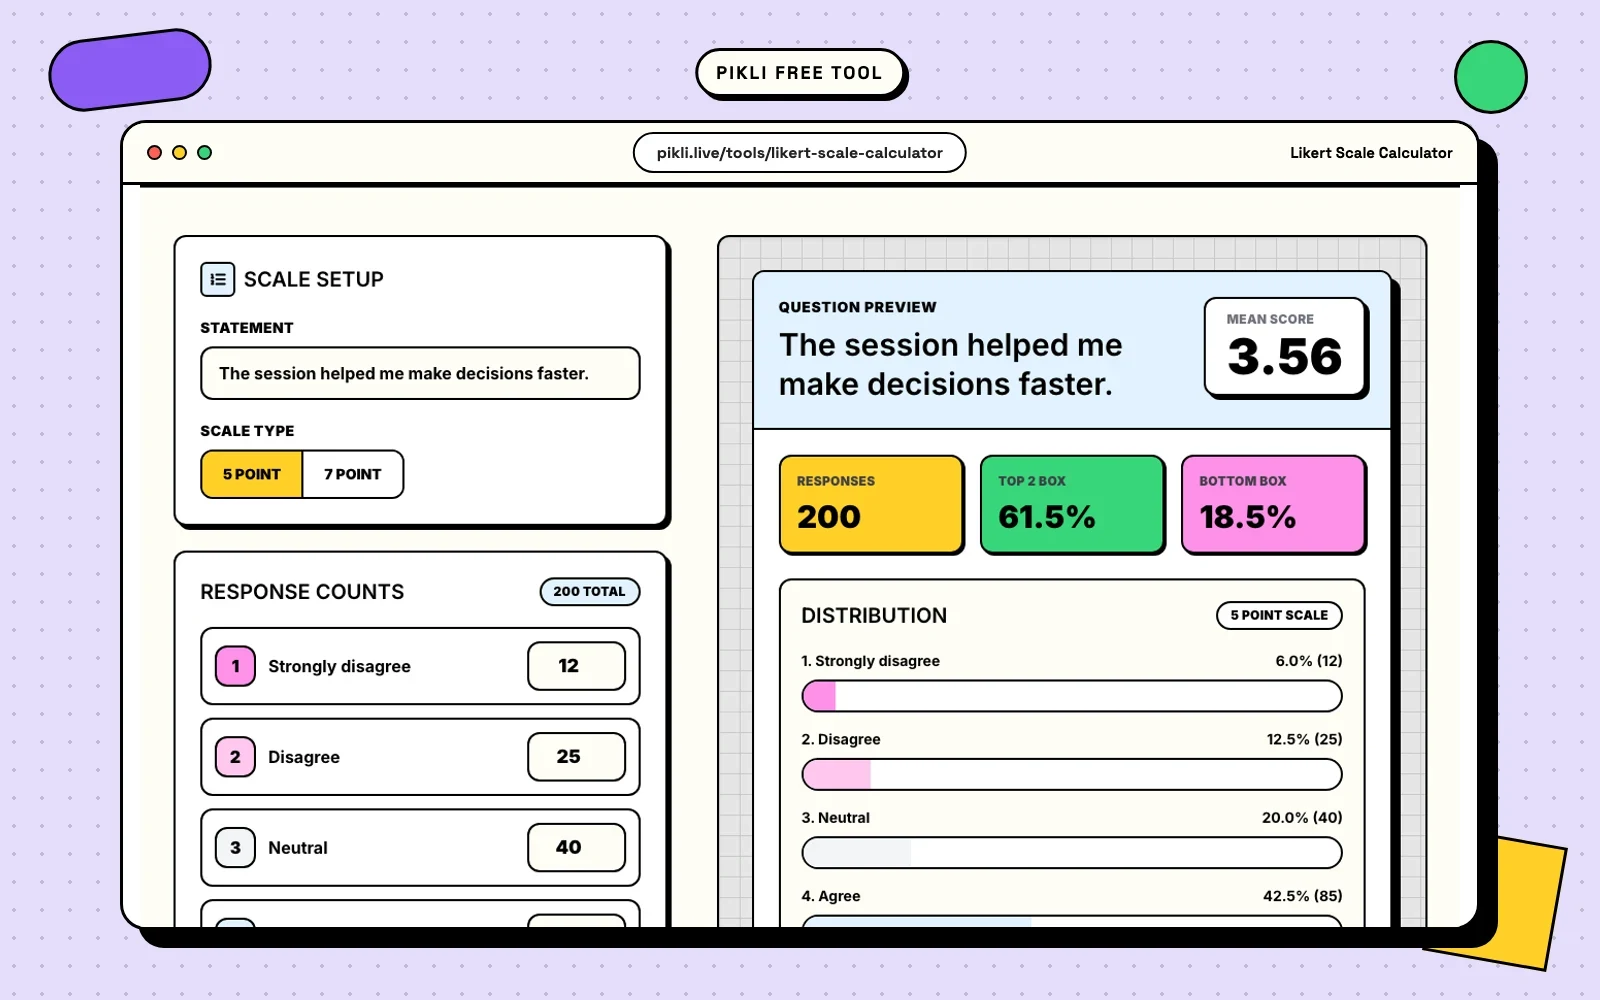
A Likert question looks easy to summarize because every answer has a number. The numbers do not automatically make the response continuous data.
“Strongly disagree,” “disagree,” “neutral,” “agree,” and “strongly agree” have a clear order. The distance between adjacent labels is not guaranteed to be equal. That is why a useful Likert analysis begins with the response distribution, not only the average.
This guide covers a practical workflow for 5-point and 7-point data. It separates a single Likert item from a multi-item scale, shows the calculations, and explains what each summary can and cannot support.
Likert item versus Likert scale
A Likert item is one statement with ordered response options:
The workshop gave me a clear next step.
The participant might select a response from 1, “strongly disagree,” to 5, “strongly agree.”
A Likert scale combines several related items intended to measure one broader construct, such as confidence, usability, or employee engagement. The item scores may be summed or averaged after the analyst checks that combining them is defensible.
This distinction matters. A distribution and median can describe one item. A composite score requires additional work: consistent direction, a missing-data rule, evidence that the items belong together, and often a reliability check.
The CDC’s guide to ordered response options describes these answers as ordinal: the categories have an order, but the magnitude of the gap between them is unknown.
A seven-step Likert analysis workflow
- Confirm the coding direction and labels.
- Clean missing and invalid responses.
- Count every response category.
- Calculate percentages and cumulative percentages.
- Add the median, mode, top-box share, and—when useful—the mean.
- Check reliability before combining multiple items.
- Report the distribution and the decision it supports.
The free Likert Scale Calculator handles steps 3 through 5 for a quick 5-point or 7-point summary.
Step 1: confirm labels and coding direction
Write down the exact label attached to each value. Do not assume every questionnaire uses the same direction.
| Score | Example label |
|---|---|
| 1 | Strongly disagree |
| 2 | Disagree |
| 3 | Neither agree nor disagree |
| 4 | Agree |
| 5 | Strongly agree |
Some exports reverse this order. Others use 0 through 4. The labels are the meaning; the numbers are a coding system.
Also identify negatively worded items. If a high score normally means a positive experience, the statement “The process was unnecessarily complicated” points in the opposite direction from “The process was easy to complete.”
For a scale with k response options, a common reverse-coding formula is:
reversed score = (k + 1) - original score
On a 5-point item, 1 becomes 5, 2 becomes 4, and 3 stays 3. Reverse the intended items before calculating a composite score.
Step 2: clean missing and invalid responses
Keep missing data separate from a real response category. Blank, “not applicable,” “prefer not to answer,” and “neutral” do not mean the same thing.
Record:
- how many people received the question;
- how many answered it;
- how many selected a non-substantive option;
- which denominator is used for each percentage.
For a multi-item scale, define a completion rule before looking at the result. For example, calculate a person’s score only when at least four of five items are answered. The acceptable rule depends on the instrument and its validation; there is no universal percentage that repairs every missing-data pattern.
Step 3: calculate the response distribution
Suppose 100 respondents answer a 5-point agreement item:
| Response | Count | Percentage |
|---|---|---|
| Strongly disagree | 4 | 4% |
| Disagree | 8 | 8% |
| Neutral | 18 | 18% |
| Agree | 42 | 42% |
| Strongly agree | 28 | 28% |
The distribution immediately shows the main result: 70% selected one of the two agreement categories, 12% selected one of the two disagreement categories, and 18% stayed neutral.
This is more informative than reporting only an average. Two groups can have the same mean and very different shapes. One may cluster around the middle; another may be split between the extremes.
Step 4: find the median and mode
The median is the category containing the middle ordered response. In the example, the cumulative count reaches 30 at neutral and 72 at agree. The 50th and 51st responses are both “agree,” so the median is 4, or “agree.”
The mode is the most frequent category. “Agree” has the largest count, so the mode is also 4.
Median and mode preserve the ordered-category interpretation. They are especially useful for a single item or a visibly skewed distribution.
Step 5: calculate top-box and bottom-box shares
Box scores collapse selected categories into a percentage.
For the example:
- Top box only, “strongly agree”:
28 / 100 = 28% - Top two boxes, “agree” plus “strongly agree”:
(42 + 28) / 100 = 70% - Bottom two boxes:
(4 + 8) / 100 = 12% - Net agreement:
70% - 12% = 58 percentage points
Name the rule every time. “Top-box score” can mean the single highest category in one organization and the two highest categories in another. A number without the included labels is ambiguous.
Box scores are easy to communicate, but they discard detail. A move from “strongly disagree” to “neutral” will not improve a top-two-box score even though the distribution changed meaningfully.
Should you calculate the mean?
If the categories are coded 1 through 5, the example mean is:
(1×4 + 2×8 + 3×18 + 4×42 + 5×28) / 100 = 3.82
The mean is common in dashboards and useful for tracking a consistently designed item over time. It also creates a compact summary for a multi-item composite.
It should not replace the distribution. A response of 4 is ordered above 3, but the psychological distance between “neutral” and “agree” may not equal the distance between “agree” and “strongly agree.” Reporting 3.82 to several decimal places suggests more precision than the scale provides.
The research literature does not reduce this to a simple ban. Sullivan and Artino’s review, Analyzing and Interpreting Data From Likert-Type Scales, notes the ordinal nature of individual responses and the limits of means, while also reviewing evidence that many parametric methods are robust under practical conditions.
A defensible reporting pattern is:
Median 4 (“agree”); 70% selected agree or strongly agree; mean 3.82 on a 1–5 scale. The full distribution is shown in the table.
How to combine several Likert items
Do not average unrelated questions just because they share the same response options.
Before creating a composite score:
- Define the construct the items are intended to measure.
- Reverse-code negatively keyed items.
- Confirm every item uses a compatible range and direction.
- Inspect item distributions and missingness.
- Check whether the items move together.
- Document whether the composite is a sum or a mean.
Cronbach’s alpha is a common internal-consistency check for items intended to measure the same construct. The free Cronbach’s Alpha Calculator can provide a quick estimate from an editable response grid.
Alpha is not proof that a scale is valid or one-dimensional. It can increase when similar items are repeated, and it relies on assumptions that may not fit every ordinal instrument. Treat it as one diagnostic, not a certificate.
Comparing two groups
Start with the same summaries for each group:
- sample size;
- category counts and percentages;
- median and mode;
- top-box rule and result;
- mean and spread if they are part of the analysis plan.
Use percentages rather than raw counts when group sizes differ. A group with 70 positive responses out of 100 is not automatically stronger than one with 40 positive responses out of 50.
For formal inference, the method should match the question and design. Common options include:
- a chi-square test for differences in the response distribution;
- Mann–Whitney U for two independent groups when an ordinal comparison is appropriate;
- Wilcoxon signed-rank for paired ordinal responses;
- Spearman correlation for monotonic associations;
- ordinal logistic regression when an ordered response is the outcome and predictors must be modeled.
Repeated measures, clustered samples, survey weights, small expected counts, and validated multi-item scales need more specific methods. Consult a statistician when the result will support a high-stakes research, clinical, employment, or policy decision.
Tracking Likert data over time
Use the same wording, labels, order, audience definition, and collection method at every wave. A trend is hard to interpret if the instrument changes at the same time as the experience.
For each period, show:
- number of valid responses;
- full category distribution;
- chosen box score;
- median;
- mean, if used consistently;
- a note about any questionnaire or sampling change.
Avoid declaring a meaningful improvement from a tiny score movement without considering sample size, response rate, and uncertainty. The Response Rate Calculator and Sample Size Calculator can help document the collection context.
Common Likert analysis mistakes
Reporting only the average
The mean hides polarization and clustering. Always keep the category distribution available.
Treating neutral as missing
Neutral is a substantive midpoint when the questionnaire offers it as one. Missing means the respondent did not provide that answer.
Mixing scales without recoding
A 1–5 item cannot be averaged directly with a 1–7 item. Convert only when the instrument and analysis plan justify it, and document the transformation.
Forgetting negative items
One unreversed item can pull a composite score in the wrong direction and reduce internal consistency.
Changing the top-box definition
Switching from the highest category to the highest two categories can create an apparent trend that comes entirely from the calculation.
Calling reliability validity
A consistent scale can measure the wrong construct. Reliability is necessary for many uses, but it does not establish that the interpretation is valid.
Comparing percentages with different denominators
Display the valid response count beside every percentage, especially when missingness differs across questions or groups.
A clear reporting template
Use a short statement that includes the audience, denominator, scale direction, and distribution summary:
Of 100 valid responses, 70% selected agree or strongly agree, 18% selected neutral, and 12% selected disagree or strongly disagree. The median and mode were both 4 (“agree”). The mean was 3.82 on a 1–5 scale, where higher values indicated stronger agreement.
For a composite, add:
The score was the mean of five items after reverse-coding two negatively worded statements. Respondents needed at least four completed items. Internal consistency was checked before the items were combined.
This gives readers enough information to understand the number and reproduce the rule.
Final checklist
Before publishing a Likert result, confirm that you can answer yes to each question:
- Are the response labels and coding direction documented?
- Are missing, neutral, and not-applicable responses separate?
- Is the full distribution available?
- Is the box-score definition explicit?
- Is the denominator shown?
- Are negative items reverse-coded?
- Were multi-item scales checked before combining?
- Is the precision appropriate for ordered categories?
- Are comparisons based on the same wording and method?
- Does the conclusion stay within what the sample and design can support?
Start with the Likert Scale Calculator to turn category counts into a distribution, mean, and box-score summary. If several questions are supposed to measure one construct, continue with the Cronbach’s Alpha Calculator and document the limitations alongside the result.
Free to use on Pikli
Summarize Likert scale results faster
Turn response counts into percentages, means, and a readable distribution.
Ready to discuss the result with your team? Start free with Pikli .
Continue exploring
Related guides
Go deeper with practical articles selected from the same topic cluster.
Survey Response Rate vs Completion Rate
Compare survey response rate and completion rate, calculate both with the right denominators, diagnose drop-off, and report the funnel clearly.
Read article → 02A/B Test Statistical Significance Explained
Learn how A/B test significance works for conversion rates, including absolute and relative lift, p-values, confidence levels, sample size, and common mistakes.
Read article → 03How to Calculate Survey Sample Size
Calculate survey sample size from population, confidence level, margin of error, and expected response rate, with formulas and worked examples.
Read article → 04NPS vs CSAT vs CES: Which Metric Should You Use?
Compare NPS, CSAT, and CES formulas, timing, use cases, and limitations. Learn which customer experience metric fits each feedback moment.
Read article →