A/B Test Statistical Significance Explained
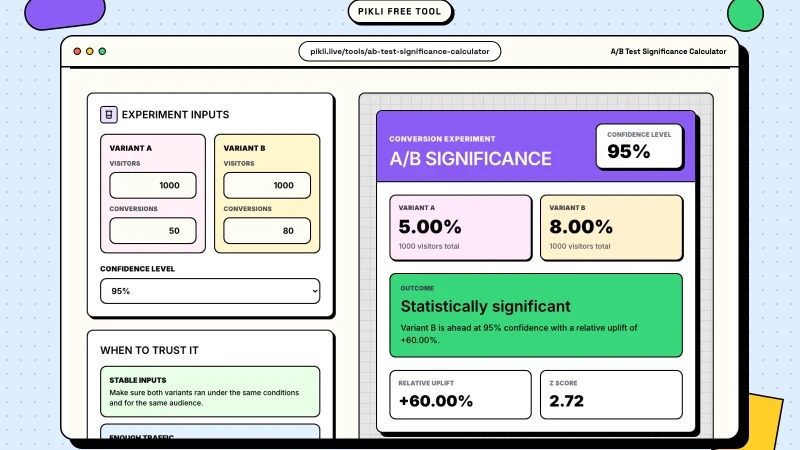
Learn how A/B test significance works for conversion rates, including absolute and relative lift, p-values, confidence levels, sample size, and common mistakes.
Playbooks, free tool workflows, and product notes for presenters, teams, educators, and creators using Pikli.
The newest playbooks, free tool workflows, and product notes from Pikli.
Learn how A/B test significance works for conversion rates, including absolute and relative lift, p-values, confidence levels, sample size, and common mistakes.
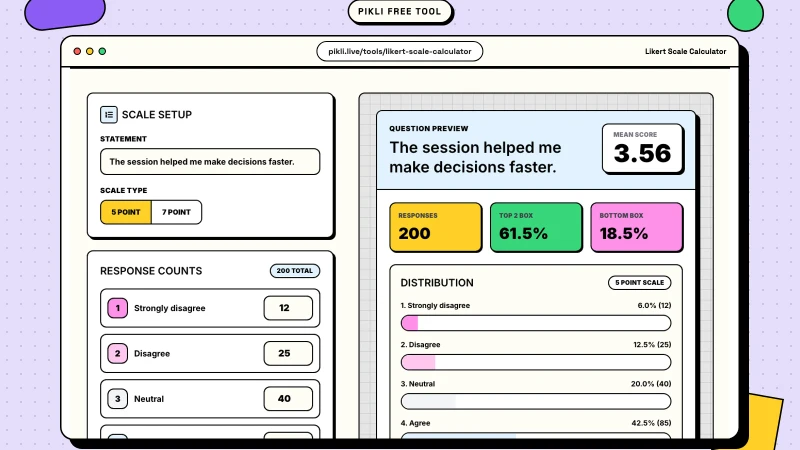
Analyze 5-point or 7-point Likert data with distributions, medians, means, top-box scores, reverse coding, reliability checks, and clear reporting.
Compare Pikli and AhaSlides for live polls, quizzes, Q&A, PowerPoint workflows, free limits, exports, surveys, and audience engagement.
Compare Pikli and Kahoot for live polls, quizzes, Q&A, presentation workflows, free audience limits, reports, training, and classroom use.
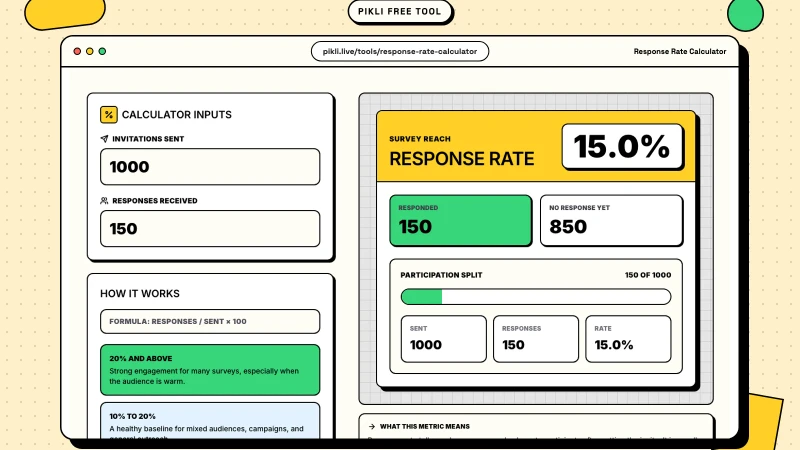
Compare survey response rate and completion rate, calculate both with the right denominators, diagnose drop-off, and report the funnel clearly.
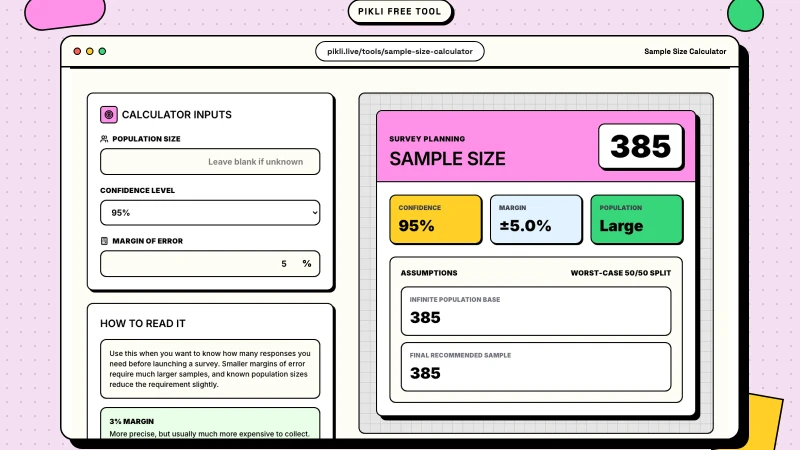
Calculate survey sample size from population, confidence level, margin of error, and expected response rate, with formulas and worked examples.
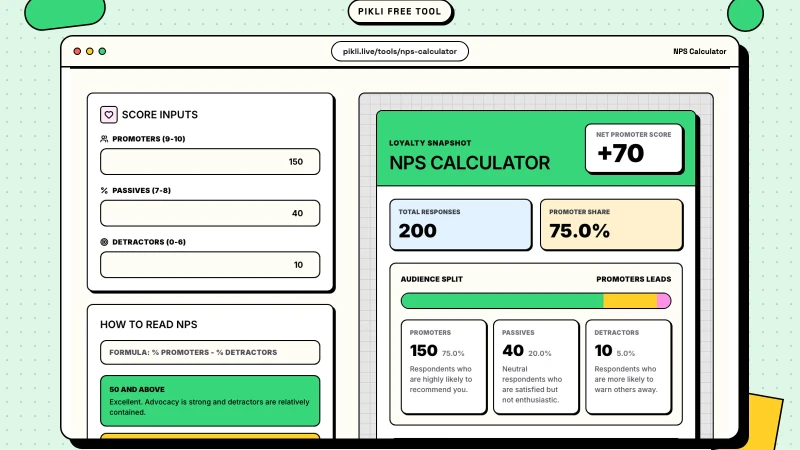
Compare NPS, CSAT, and CES formulas, timing, use cases, and limitations. Learn which customer experience metric fits each feedback moment.
A practical comparison of Pikli and Mentimeter for live polls, Q&A, quizzes, presentation workflows, free limits, and different audience sizes.
Compare Pikli and Poll Everywhere for free limits, PowerPoint, live polls, Q&A, exports, classroom use, pricing, and enterprise controls.
Compare Pikli and Slido for live polls, Q&A, quizzes, presentation integrations, exports, free limits, paid plans, and audience sizes.
Pikli's Agent API and local CLI let approved scripts and agents manage room-scoped polls without sharing main account access.
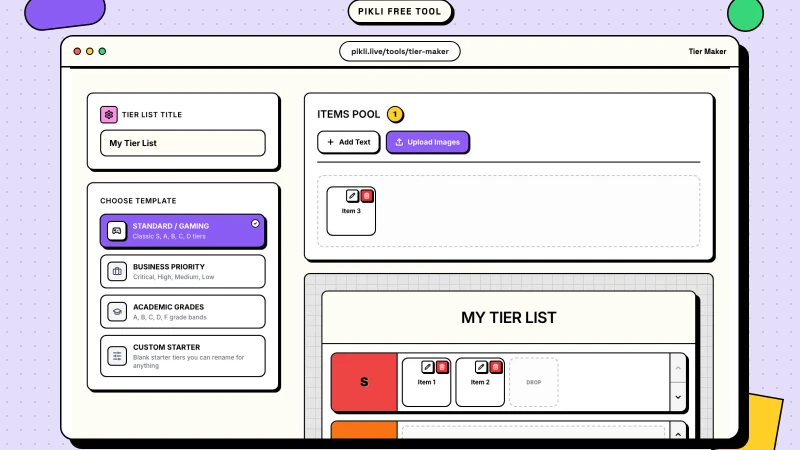
Tier lists turn opinions into visuals people can scan, challenge, and share. Learn when a tier maker works best and how to pair it with Pikli for live input.
Use live polling to check understanding, expose misconceptions, run peer discussion, include quieter students, and choose the next teaching move.
Make presentations interactive with seven practical ideas for polls, word clouds, Q&A, and audience feedback that work with your existing deck.
Turn passive viewers into active participants with polls, rankings, and recurring interaction loops that fit streams, videos, and communities.
Use lightweight pulse checks and anonymous questions to surface silent friction before it turns into a bigger team problem.
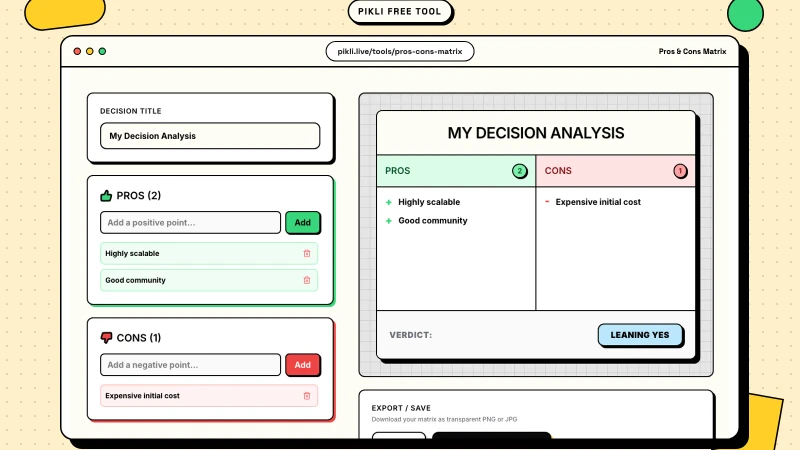
Stop making overwhelming decisions by guesswork. Learn how a visual pros and cons matrix brings clarity to complex choices and reduces decision anxiety.
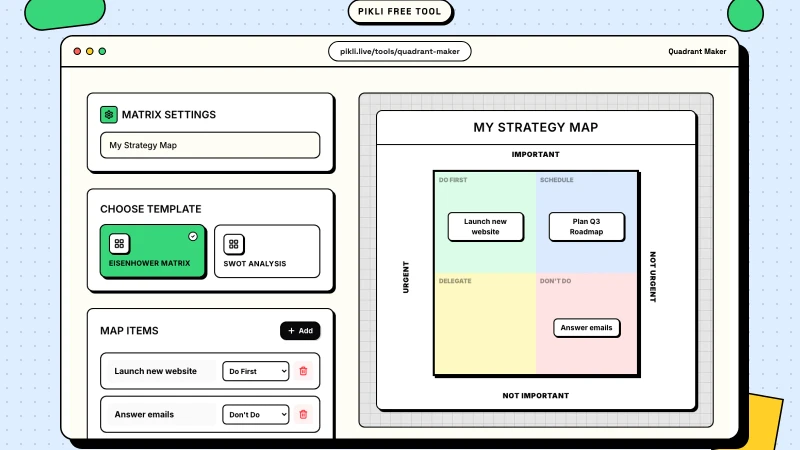
Learn how quadrant charts turn complex tradeoffs into clear visuals, and when frameworks like Eisenhower or BCG help teams compare priorities fast.
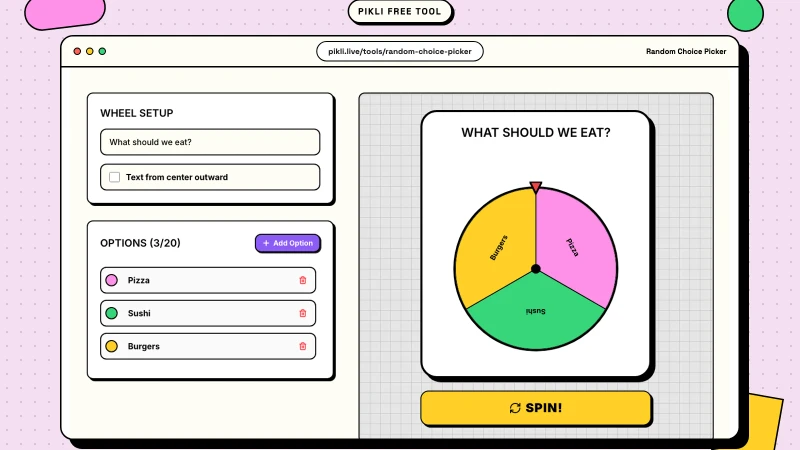
Overcome decision paralysis with a fair, fun random choice picker tool. Learn why your brain fights simple choices and how randomness can help.
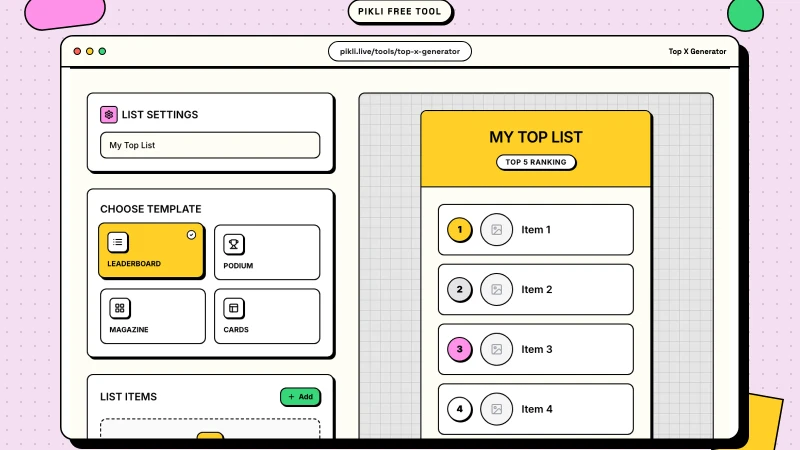
Create professional visual rankings instantly with our free Top X generator. Perfect for social media, presentations, and content marketing.