Survey Response Rate vs Completion Rate
Compare survey response rate and completion rate, calculate both with the right denominators, diagnose drop-off, and report the funnel clearly.
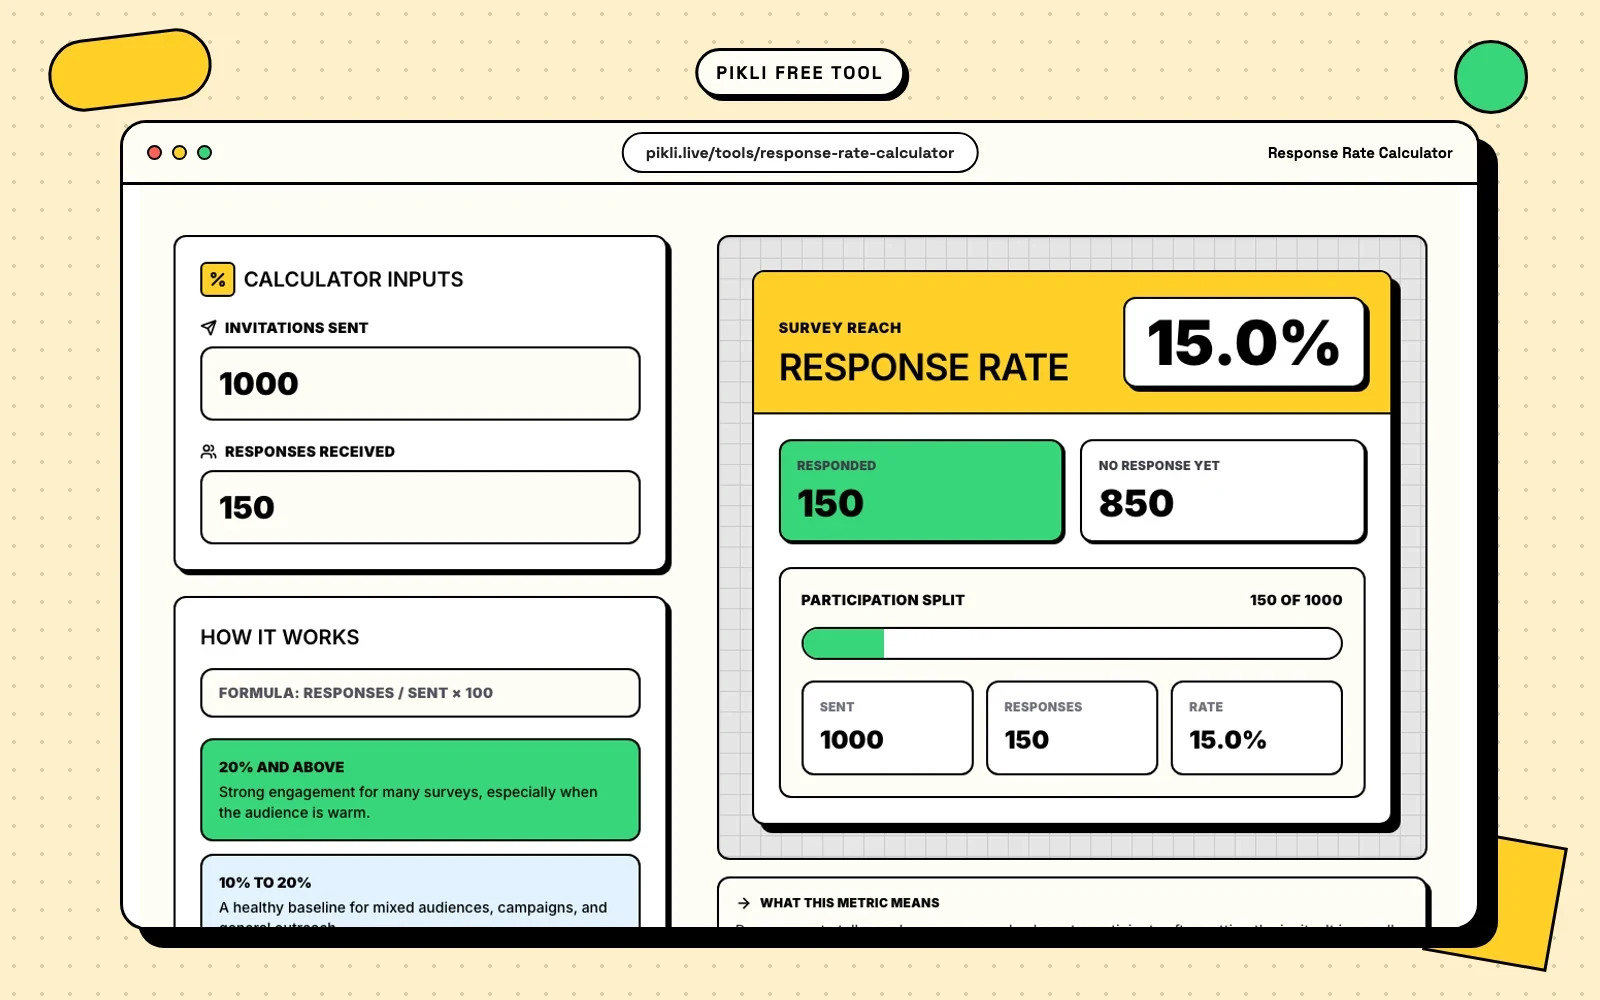
A survey can have a low response rate and a high completion rate at the same time. That is not a contradiction.
Response rate asks how many invited people provided the required response. Completion rate asks how many people who started reached the defined finish. The numerator may be the same, but the denominators describe different parts of the funnel.
Confusing the two can send a team toward the wrong fix. More reminders will not repair a form that people abandon halfway through. Shortening a survey will not help if the invitation never reaches the right audience.
The short definition
For a simple invited survey:
response rate = completed responses / eligible invitations × 100
For the survey experience itself:
completion rate = completed responses / survey starts × 100
Use response rate to evaluate recruitment and participation. Use completion rate to evaluate what happens after someone begins.
Formal survey research can require more detailed response-rate definitions. The AAPOR overview distinguishes response, cooperation, refusal, contact, and other outcome rates. It also accounts for eligibility and cases whose eligibility is unknown. State the formula you use instead of assuming every reader uses the same standard.
A worked survey funnel
Suppose a team sends 1,000 valid invitations:
| Funnel stage | People | Rate from previous stage |
|---|---|---|
| Eligible invitations delivered | 1,000 | — |
| Survey started | 300 | 30% start rate |
| Survey completed | 240 | 80% completion rate |
The simple response rate is:
240 / 1,000 × 100 = 24%
The completion rate is:
240 / 300 × 100 = 80%
The abandonment rate after starting is:
(300 - 240) / 300 × 100 = 20%
All three numbers describe the same survey, but each points to a different operational question.
Response rate: did the audience participate?
Response rate looks outward from the invitation list. In the simplest model, it compares completed questionnaires with the people asked to participate.
The CDC response-rate brief uses this simple explanation while noting that the calculation becomes more complex with different evaluation designs.
Response rate is affected by:
- list quality and eligibility;
- email delivery and spam filtering;
- subject line and invitation clarity;
- trust in the sender;
- perceived relevance;
- timing and reminders;
- incentive design;
- survey burden stated before the click;
- language and accessibility;
- whether the audience has a real opportunity to respond.
The free Response Rate Calculator provides a quick responses-divided-by-invitations summary. For formal research, replace the simple denominator with the appropriate standardized disposition formula.
Completion rate: did starters reach the end?
Completion rate starts later in the funnel. It compares completed questionnaires with people who began.
It is affected by:
- actual survey length;
- mobile usability;
- confusing instructions;
- repetitive or irrelevant questions;
- required questions that do not fit every respondent;
- slow page loads or technical errors;
- privacy concerns that appear mid-survey;
- poor progress indicators;
- complex grids and open-text tasks;
- screening logic and unexpected disqualification.
The free Completion Rate Calculator calculates completes divided by starts and shows the corresponding drop-off.
The denominator is the decision
Most rate disputes are denominator disputes.
Before calculating response rate, define:
- Was the invitation delivered?
- Was the person eligible?
- Does a partial questionnaire count as a response?
- Are duplicate invitations deduplicated by person?
- Are panel members, public-link visitors, and directly invited participants mixed?
- How are unknown-eligibility cases treated?
Before calculating completion rate, define:
- What event counts as a start?
- Does opening the landing page count, or must the first answer be submitted?
- What event counts as complete?
- Can a respondent skip questions and still complete?
- Are screened-out respondents successful completes for the screener but not the main survey?
- Are restarts merged into one respondent journey?
Write these rules before comparing surveys or time periods.
Response, start, completion, and cooperation are not interchangeable
A useful funnel separates at least four events:
- Invited: the person was selected and sent a valid invitation.
- Reached or contacted: the invitation had a reasonable chance to be seen.
- Started: the person entered the survey under the defined start rule.
- Completed: the person met the completion rule.
Formal survey standards add disposition categories for refusals, noncontacts, partial interviews, ineligible units, and cases of unknown eligibility.
A “completion rate” reported by a panel provider may use invited panelists as the denominator rather than starters. For example, some studies use an AAPOR response-rate definition but label the result a survey completion rate. Always read the formula, not only the metric name.
How to interpret the combination
Low response rate, high completion rate
Few invited people participate, but those who start usually finish.
Investigate recruitment:
- invitation delivery;
- audience relevance;
- sender trust;
- reminders;
- incentives;
- timing;
- the value promised before the survey opens.
The form itself may be healthy.
High start rate, low completion rate
The invitation works, but the survey loses people after entry.
Investigate friction:
- drop-off by page or question;
- mobile rendering;
- questionnaire length;
- confusing grids;
- required fields;
- technical errors;
- sensitive questions;
- mismatch between promised and actual effort.
Low response rate, low completion rate
The survey has problems before and after the click. Prioritize tracking accuracy first, then repair the largest funnel loss.
High response rate, high completion rate
The funnel is working, but the rate alone does not prove representative or accurate data. A highly engaged subgroup can respond at a high rate while important groups remain undercovered.
There is no universal good benchmark
A response rate that is realistic for a public customer survey may be poor for a mandatory internal process. A five-minute event survey and a 45-minute academic questionnaire should not share one completion benchmark.
Interpret the rate using:
- collection mode;
- relationship with the audience;
- survey length and sensitivity;
- incentive;
- population accessibility;
- previous waves using the same method;
- segment-level participation;
- the decision the data will support.
Do not promise representativeness from one percentage. Pew Research describes survey quality through a total survey error framework that includes coverage, sampling, nonresponse, measurement, processing, and adjustment error.
How to improve response rate
Work before the survey starts:
- Remove invalid and ineligible contacts.
- Explain why the recipient was selected.
- Use a recognizable sender.
- State the purpose and expected time honestly.
- Explain confidentiality and data use.
- Test the invitation on mobile and common email clients.
- Send a limited reminder sequence to nonrespondents.
- Offer an appropriate incentive when the context supports it.
- Provide language and accessibility options.
- Monitor response by segment, not only in aggregate.
A reminder can increase starts. It cannot make an already-started questionnaire easier to finish.
How to improve completion rate
Work inside the survey:
- Remove questions that do not support a decision.
- Put essential questions before optional detail.
- Replace large matrix grids with simpler mobile-friendly items.
- Use routing so respondents see only relevant questions.
- Make “not applicable” available when it is a real answer.
- Explain sensitive questions before asking them.
- Avoid requiring open text without a clear reason.
- Test the full experience on a slow phone connection.
- Track abandonment by page or question.
- Compare form variants with consistent audiences and timing.
Completion can improve while data quality declines if the survey becomes too shallow. Keep the questions necessary for the research objective.
Planning invitations from a response target
If an analysis needs a target number of completed responses, expected response rate converts that target into an invitation estimate:
required invitations = target completes / expected response rate
If the target is 400 completes and the expected response rate is 25%:
400 / 0.25 = 1,600 invitations
Completion rate can refine the funnel when starts are planned separately:
required starts = target completes / expected completion rate
At an 80% completion rate:
400 / 0.80 = 500 starts
Read How to Calculate Survey Sample Size before treating the response target as a statistical requirement. The number of invitations, starts, completes, and usable responses are related but not interchangeable.
Segment the rates carefully
An overall rate can hide a weak experience for one audience.
Review response and completion by preexisting operational segments such as:
- device type;
- invitation channel;
- language;
- region;
- customer lifecycle stage;
- panel source;
- reminder wave.
Do not create dozens of tiny segments and overinterpret noise. Define the important comparisons in advance and show the counts with every percentage.
A clear reporting template
Report the whole funnel and the exact rules:
We delivered 1,000 invitations to eligible recipients. Three hundred people submitted the first survey answer, and 240 met the completion rule. The simple response rate was 24% of eligible invitations. The completion rate was 80% of starts, and 20% of starters abandoned before completion.
Then add:
- field dates;
- invitation and reminder schedule;
- eligibility rules;
- start and completion event definitions;
- partial-response treatment;
- invalid and duplicate exclusions;
- segment differences;
- changes from the previous wave.
Final checklist
Before publishing either rate, confirm:
- Is the numerator defined?
- Is the denominator defined?
- Are delivered, eligible, started, and completed counts separate?
- Are partial responses handled consistently?
- Are duplicate people deduplicated?
- Are public links separated from invited samples?
- Are segment counts shown with percentages?
- Is the same formula used across comparisons?
- Are recruitment and in-survey problems diagnosed separately?
- Does the conclusion avoid treating response rate as proof of representativeness?
Use the Response Rate Calculator for the invitation-level percentage and the Completion Rate Calculator for the starter-level percentage. Report both when the survey platform can capture the full funnel.
Free to use on Pikli
Calculate your survey response rate
Enter invitations and responses to check the rate before you diagnose drop-off.
Ready to discuss the result with your team? Start free with Pikli .
Continue exploring
Related guides
Go deeper with practical articles selected from the same topic cluster.
How to Analyze Likert Scale Data
Analyze 5-point or 7-point Likert data with distributions, medians, means, top-box scores, reverse coding, reliability checks, and clear reporting.
Read article → 02How to Calculate Survey Sample Size
Calculate survey sample size from population, confidence level, margin of error, and expected response rate, with formulas and worked examples.
Read article → 03A/B Test Statistical Significance Explained
Learn how A/B test significance works for conversion rates, including absolute and relative lift, p-values, confidence levels, sample size, and common mistakes.
Read article → 04NPS vs CSAT vs CES: Which Metric Should You Use?
Compare NPS, CSAT, and CES formulas, timing, use cases, and limitations. Learn which customer experience metric fits each feedback moment.
Read article →