NPS vs CSAT vs CES: Which Metric Should You Use?
Compare NPS, CSAT, and CES formulas, timing, use cases, and limitations. Learn which customer experience metric fits each feedback moment.
A customer can give you 5 out of 5 for support, struggle through the process, and still refuse to recommend your company. That is not a contradiction.
CSAT, CES, and NPS measure different parts of the experience:
- CSAT asks whether a specific interaction was satisfactory.
- CES asks whether a task was easy or difficult.
- NPS asks whether the wider relationship is strong enough for a recommendation.
The useful question is not “Which metric is best?” It is “Which decision will this answer help us make?”
NPS vs CSAT vs CES at a glance
| Metric | What it measures | Best time to ask | Typical scale | Pikli calculator output |
|---|---|---|---|---|
| NPS | Stated likelihood to recommend | At a stable relationship checkpoint | 0 to 10 | Promoter percentage minus detractor percentage |
| CSAT | Satisfaction with a defined interaction | Immediately after the interaction | Usually 1 to 5 | Percentage of responses rated 4 or 5 |
| CES | Ease or difficulty of completing a task | Immediately after task completion | Often 1 to 7 | Percentage of responses rated easy, 5 to 7 |
Do not compare the three numbers directly. An NPS of 35, CSAT of 77%, and easy-response share of 80% are not three versions of the same score. Each has a different question, scale, and denominator.
What NPS measures
Net Promoter Score asks:
How likely are you to recommend [company, product, or service] to a friend or colleague?
Respondents answer from 0 to 10. The Net Promoter System methodology divides them into three groups:
- Promoters: 9 or 10
- Passives: 7 or 8
- Detractors: 0 through 6
The formula is:
NPS = % promoters - % detractors
Suppose 200 customers respond. You have 110 promoters, 50 passives, and 40 detractors.
- Promoters: 110 / 200 = 55%
- Detractors: 40 / 200 = 20%
- NPS: 55 - 20 = 35
Passives remain in the total response count but do not appear directly in the subtraction.
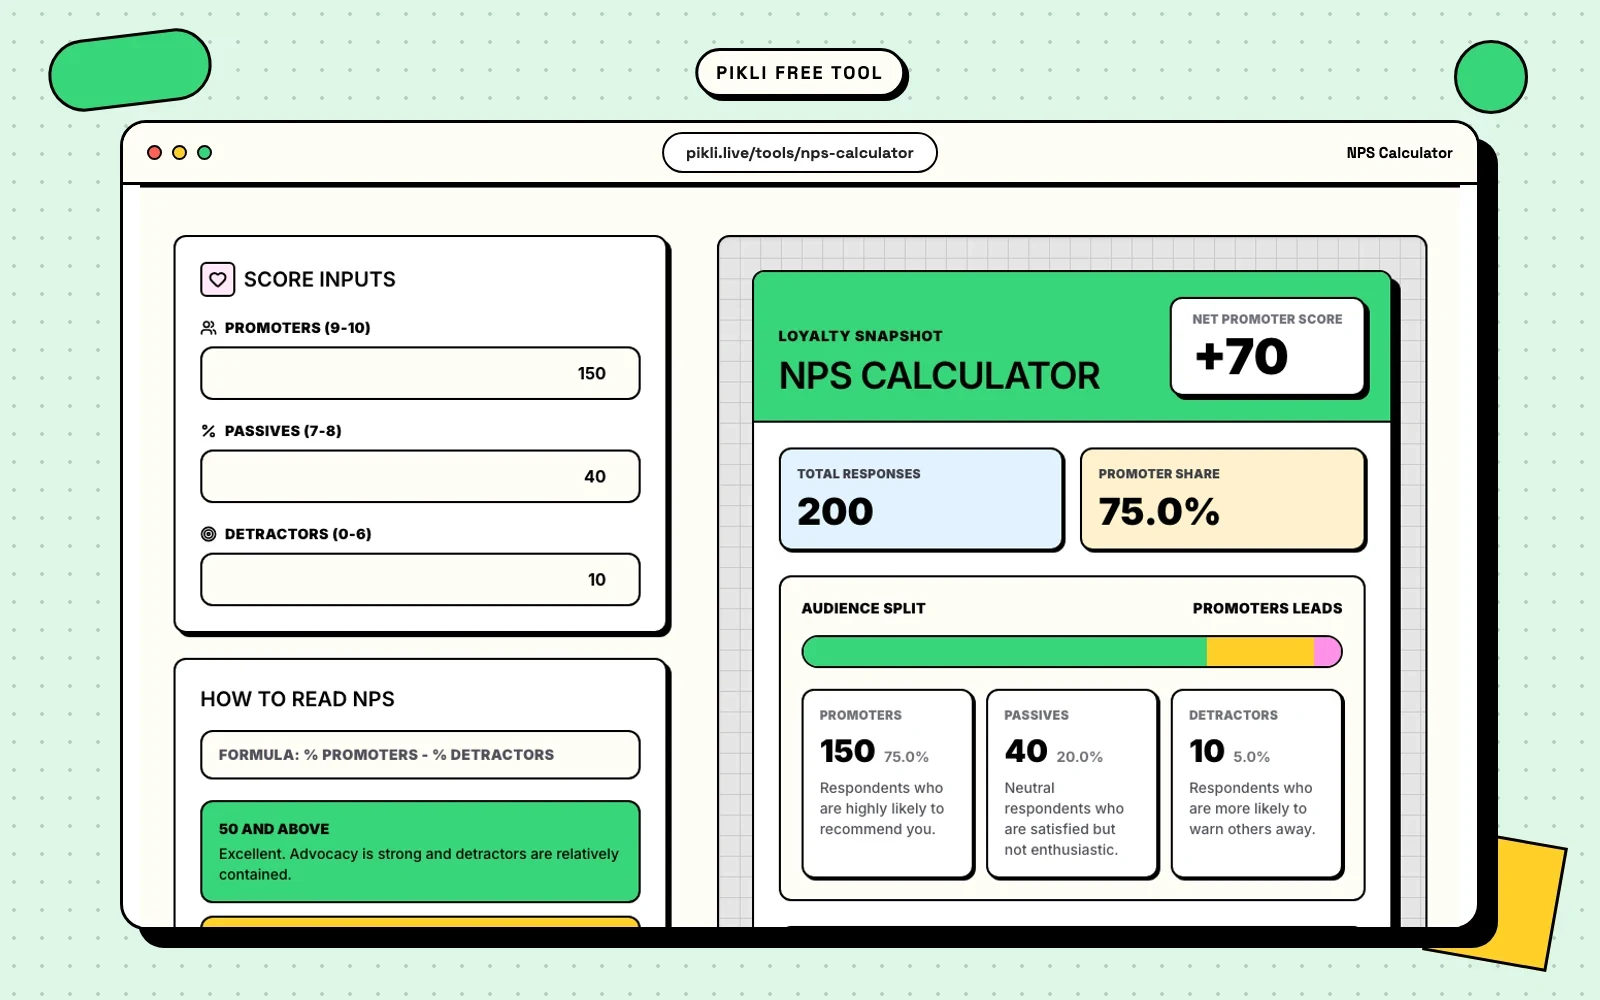
Use the free NPS Calculator when you already have promoter, passive, and detractor counts.
When NPS is useful
NPS works best as a repeated relationship signal. Ask it at a consistent point such as 90 days after onboarding, after a renewal cycle, or on a fixed quarterly schedule.
It can help you answer questions such as:
- Is stated advocacy moving after a major product or service change?
- Which customer segment has the highest share of detractors?
- Are relationship scores moving in the same direction as retention and expansion?
Keep the wording, audience, channel, and timing stable. A score collected from active power users inside the product is not comparable with one collected from every customer by email.
What NPS cannot tell you
NPS does not explain why the score changed. Pair it with an open-text follow-up and behavioral data such as renewal, usage, or churn.
It is also not proven to be the single best predictor of growth in every market. A 2007 longitudinal study covering 21 firms and more than 15,500 interviews failed to reproduce claims that NPS was clearly superior to other customer measures. Treat NPS as one signal, not a replacement for the rest of your customer data.
What CSAT measures
Customer Satisfaction Score usually asks:
How satisfied were you with [specific interaction]?
On a five-point scale, 1 means very dissatisfied and 5 means very satisfied. Responses of 4 and 5 are normally counted as satisfied.
The formula is:
CSAT = satisfied responses / total responses x 100
If 154 out of 200 respondents select 4 or 5, your CSAT is 77%.
This top-two-box calculation matches the method described in SurveyMonkey’s CSAT documentation. The denominator includes neutral and dissatisfied responses.
Use the free CSAT Calculator to turn satisfied, neutral, and dissatisfied counts into a percentage and scorecard.
When CSAT is useful
CSAT is strongest when the subject is narrow and recent:
- a resolved support conversation;
- a completed onboarding step;
- checkout or delivery;
- a training session or event;
- a specific product workflow.
Name the interaction in the question. “How satisfied are you with us?” mixes product quality, price, service, brand expectations, and the respondent’s entire history. “How satisfied were you with the support you received today?” gives one team something it can act on.
What CSAT cannot tell you
A satisfied customer is not automatically loyal. They may rate a support agent highly while planning to leave because the product is expensive or missing a feature.
CSAT is also sensitive to who responds. Customers who ignore the survey are absent from the score. Track response rate and compare like with like instead of treating 90% from 20 responses as stronger evidence than 82% from 2,000.
What CES measures
Customer Effort Score asks how easy or difficult it was to complete a task. A useful statement is:
It was easy for me to resolve my issue today.
Respondents can answer on a seven-point agreement scale from strongly disagree to strongly agree. Ask immediately after a task such as account setup, checkout, a return, or a support resolution.
The original customer-effort argument came from research into service interactions. The authors of “Stop Trying to Delight Your Customers” argued that reducing the work customers must do can matter more than adding service extras. That does not mean effort explains every part of customer loyalty. It makes CES a focused diagnostic for friction.
There is no single CES formula
This is where many dashboards become misleading.
Some programs calculate the mean response. For example, SurveyMonkey describes CES as the sum of all ratings divided by the response count. Other programs report the percentage of customers who selected an easy response.
Pikli’s CES Calculator uses a seven-point scale and reports the easy-response share:
Easy share = responses rated 5 to 7 / total responses x 100
If 160 out of 200 respondents select 5, 6, or 7, the result is 80% easy.
This is a top-box-style percentage, not a mean CES. Label it clearly in exports. Never place an 80% easy share beside a mean score of 5.4 and call one better.
When CES is useful
Use CES when a customer had a job to finish:
- resolving an issue;
- creating an account;
- changing a subscription;
- finding an answer in self-service;
- completing checkout or a return.
Pair the score with operational evidence. A checkout may receive a good effort score while still showing high abandonment. A support workflow may feel easy to respondents but produce repeat contacts. The survey tells you what the task felt like; behavior tells you what happened.
Which metric should you choose?
Start with the decision, then choose the question.
| Decision you need to make | Use | Pair it with |
|---|---|---|
| Did today’s support interaction land well? | CSAT | Reopen rate and qualitative comments |
| Is onboarding too hard to complete? | CES | Completion time and abandonment |
| Is the customer relationship improving over time? | NPS | Retention, expansion, and product usage |
| Which touchpoint creates the most friction? | CES | Funnel completion by step |
| Which service team needs coaching or process work? | CSAT | Issue type and first-contact resolution |
| Which customer segment has the weakest advocacy? | NPS | Segment size, tenure, and revenue |
If the decision is “fix this interaction,” start with CSAT or CES. If the decision is “track the wider relationship,” use NPS.
How to use all three without exhausting customers
Do not place NPS, CSAT, and CES in one long survey just because the dashboard has three empty boxes.
A simpler program is easier to answer and easier to operate:
- After a service interaction: ask CSAT if you need to assess the outcome, or CES if you need to diagnose friction. Pick one primary question.
- After a key workflow: ask CES and one optional “What made this difficult?” follow-up.
- At a relationship checkpoint: ask NPS and one “What is the main reason for your score?” follow-up.
- In the review meeting: combine survey results with usage, retention, completion, or re-contact data.
Use sampling rules so the same customer is not asked after every click. Record the survey trigger, channel, scale, and response window with the result. Without that context, a trend line can change because the measurement changed rather than the experience.
Avoid fake benchmarks
There is no universal “good” score that applies to every sector, channel, customer group, and survey method.
Benchmark against your own stable baseline first. Segment by the part of the journey that someone can actually improve. If you need a defensible sample for a wider survey, use the Sample Size Calculator and monitor invitations with the Response Rate Calculator.
The most useful comparison is usually not your NPS against an unrelated industry average. It is this quarter’s score against the same customer segment, using the same question and collection method, after a specific change.
Turn the scores into a decision
Calculating the metric is the easy part. Decide what happens when a score crosses a threshold or a pattern appears.
For example:
- A CES drop can trigger a workflow review with the team that owns the step.
- Repeated low CSAT for one issue type can trigger call review or product fixes.
- An NPS decline in one customer segment can trigger interviews before a retention campaign is designed.
In a live review, show the score, ask the team to rank likely causes, and collect the next actions. Pikli can run that discussion with live polls, rankings, and Q&A. Start a free Pikli room, or calculate the first baseline with the NPS, CSAT, or CES tool.
Free to use on Pikli
Calculate your first NPS baseline
Enter promoters, passives, and detractors to get the score and distribution.
Ready to discuss the result with your team? Start free with Pikli .
Continue exploring
Related guides
Go deeper with practical articles selected from the same topic cluster.
A/B Test Statistical Significance Explained
Learn how A/B test significance works for conversion rates, including absolute and relative lift, p-values, confidence levels, sample size, and common mistakes.
Read article → 02How to Analyze Likert Scale Data
Analyze 5-point or 7-point Likert data with distributions, medians, means, top-box scores, reverse coding, reliability checks, and clear reporting.
Read article → 03Survey Response Rate vs Completion Rate
Compare survey response rate and completion rate, calculate both with the right denominators, diagnose drop-off, and report the funnel clearly.
Read article → 04How to Calculate Survey Sample Size
Calculate survey sample size from population, confidence level, margin of error, and expected response rate, with formulas and worked examples.
Read article →