How to Calculate Survey Sample Size
Calculate survey sample size from population, confidence level, margin of error, and expected response rate, with formulas and worked examples.
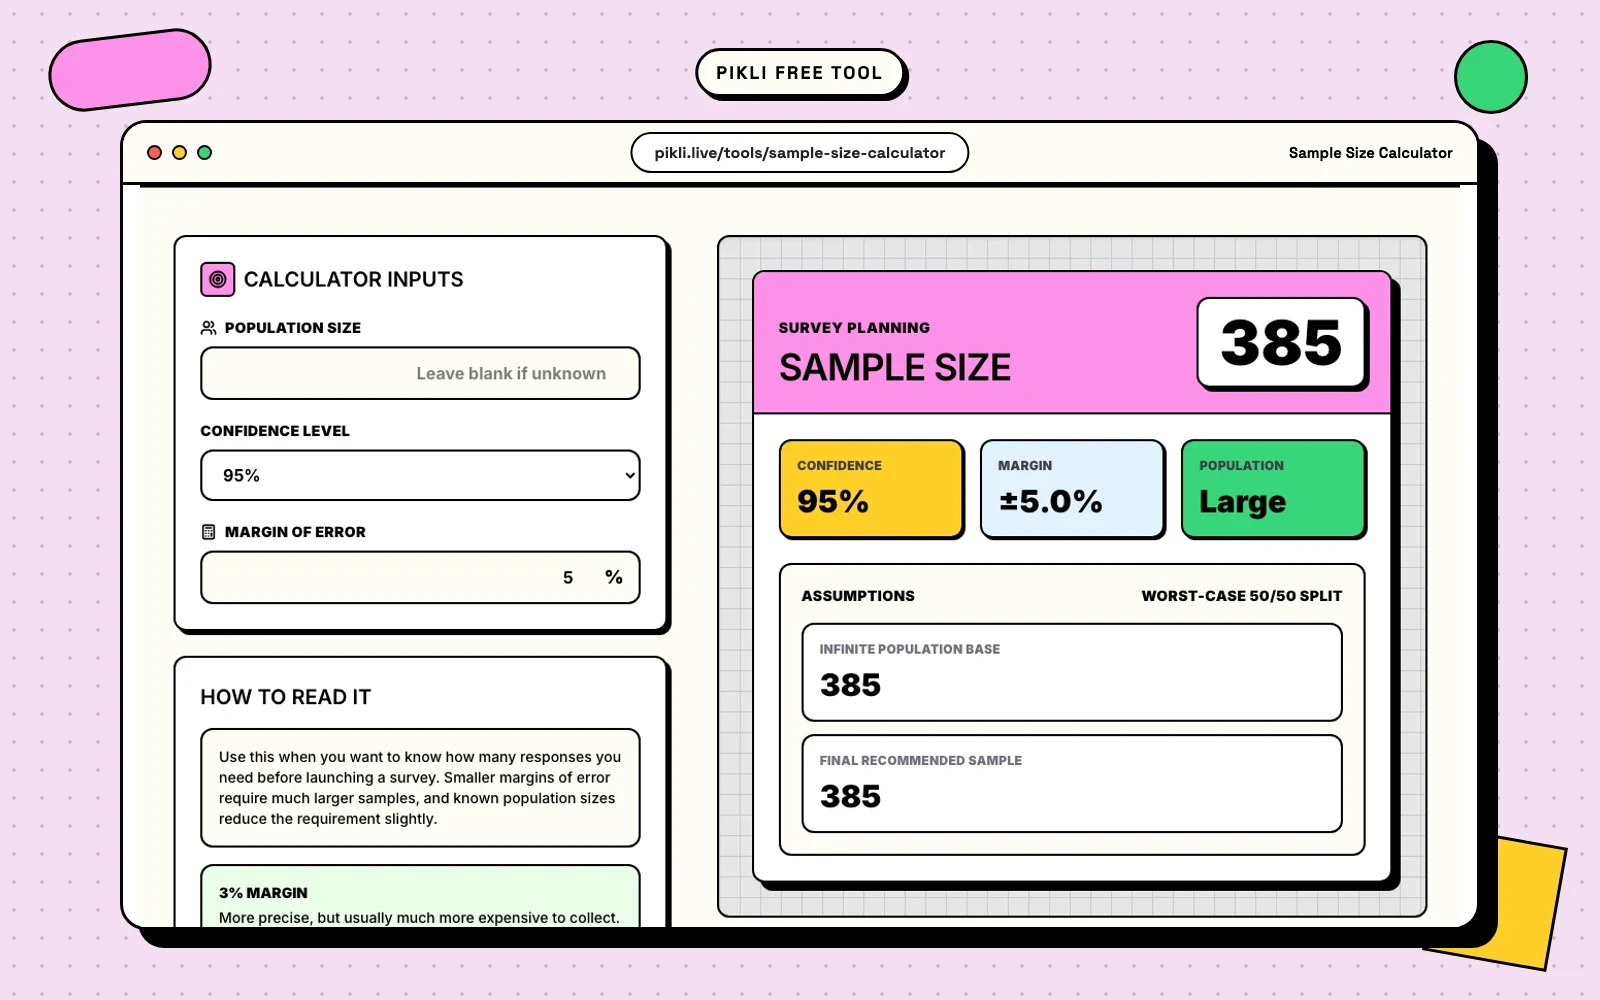
Sending 1,000 survey invitations does not give you a sample size of 1,000. Your sample is the number of usable responses you collect.
That distinction changes the plan. First calculate how many completed responses you need. Then estimate how many people you must invite to reach that target.
For a survey that estimates a percentage, four inputs drive the basic calculation:
| Input | What it means | Common planning choice |
|---|---|---|
| Population size | Everyone eligible for the survey | Use the known total, or leave it blank for a large population |
| Confidence level | How often the method should capture the true value across repeated samples | 90%, 95%, or 99% |
| Margin of error | The sampling range you will accept around an estimate | Often ±3, ±5, or ±10 percentage points |
| Expected proportion | The percentage you expect to select an answer | Use 50% when you do not have a defensible estimate |
The free Sample Size Calculator uses these inputs and assumes a 50/50 response split. This produces the largest sample requirement for a proportion at a given confidence level and margin of error.
The survey sample size formula
For a large or unknown population, the standard formula for estimating a proportion is:
n0 = z² × p(1 - p) / e²
Where:
n0is the sample size before any population correction;zis the critical value for the selected confidence level;pis the expected proportion as a decimal;eis the margin of error as a decimal.
Typical two-sided critical values are 1.645 for 90% confidence, 1.96 for 95%, and 2.576 for 99%.
The formula is based on a normal approximation for a binomial proportion. NIST explains the normal-approximation basis, starts with a random sample, and notes that the approximation needs a sufficiently large sample.
Why use 50% for the expected proportion?
The term p(1 - p) is largest when p = 0.5. If you do not know the likely result, 50% is the conservative choice because it asks for the largest sample.
If reliable prior data suggests the result will be near 10%, using p = 0.10 can reduce the calculated requirement. That smaller number is only defensible if the prior estimate fits the same audience and question. Pikli’s calculator stays with 50% so the default does not depend on an untested forecast.
Worked example: 95% confidence and ±5% error
Suppose you want to survey customers from a large audience. You choose:
- 95% confidence, so
z = 1.96; - ±5 percentage points, so
e = 0.05; - a 50/50 split, so
p = 0.5.
Put those values into the formula:
n0 = 1.96² × 0.5 × 0.5 / 0.05²
n0 = 384.16
Round up. You need 385 completed responses for the large-population calculation.
Do not round down to 384. The decimal result is the minimum required by the assumptions, so rounding down would miss the target.
Adjust for a known population
If you sample without replacement from a known, finite population, apply the finite population correction:
n = n0 × N / (n0 + N - 1)
Here, N is the total population size.
For a population of 10,000 and the same 95% confidence and ±5% margin:
n = 384.16 × 10,000 / (384.16 + 10,000 - 1)
n = 369.98
Round up to 370 completed responses.
Population size matters most when the sample is a meaningful share of the full group. It has little effect when the audience is very large. NIST’s finite population guidance describes this correction for sampling without replacement.
Only enter people who are eligible for the survey. If your database has 50,000 records but only 8,000 are active customers in scope, the population is 8,000.
Convert completed responses into invitations
The sample-size result is a completion target. It is not an invitation target.
Use this planning formula:
Invitations needed = required completed responses / expected response rate
If you need 370 completed responses and expect a 30% response rate:
370 / 0.30 = 1,233.33
Round up to 1,234 invitations.
Estimate the response rate from your own recent surveys with a similar audience, channel, topic, and survey length. A customer survey sent after a support interaction will not behave like cold outreach to a purchased list. If you have sent a survey already, the Response Rate Calculator gives the simple participation rate:
Responses received / invitations sent × 100
For formal research reporting, record how partial responses, ineligible contacts, and cases of unknown eligibility are treated. AAPOR publishes six standard response-rate definitions, so a simple completed-responses ratio should not be presented as an AAPOR rate unless the denominator follows the selected definition.
Confidence level and margin of error are different
The confidence level describes the long-run performance of the interval method. With 95% confidence, 95% of intervals produced from repeated samples under the same design would contain the true population value.
It does not mean there is a 95% probability that the fixed population value lies inside one interval after you calculate it.
The margin of error is the half-width of the interval. If 60% of a valid sample supports an option and the margin of error is ±5 points, the reported interval is 55% to 65%.
Use the Margin of Error Calculator when you know the sample size and want a conservative precision estimate. Pikli uses p = 0.5 for that tool, which gives the widest normal-approximation margin for a proportion.
Use the Confidence Interval Calculator when you also know the observed percentage. It calculates:
observed proportion ± z × √(p(1 - p) / n)
This normal, or Wald, interval is a quick approximation. NIST warns that symmetrical normal intervals can be inaccurate for small samples or proportions near 0% or 100%. Use an exact or another suitable binomial interval for those cases.
What a sample-size calculator does not solve
A bigger sample reduces random sampling error. It does not remove every source of survey error.
The calculation assumes the responses represent the population. Results can still be biased when:
- people select themselves into the survey;
- nonrespondents differ from respondents;
- the contact list excludes part of the target audience;
- a leading or confusing question changes answers;
- weighting increases variance;
- respondents are sampled in clusters rather than independently.
Pew Research Center describes total survey error as a combination of coverage, sampling, nonresponse, measurement, processing, and adjustment errors. Its analysis of survey variability shows why a narrow margin of error can still sit around a biased estimate.
This is why 10,000 voluntary website responses can be less representative than a smaller probability sample. Precision around a biased center is still bias.
If your design uses clusters, unequal selection probabilities, or heavy weights, work with a survey statistician and include the design effect in the sample plan. The basic Pikli calculator assumes a simple random sample and a design effect of 1.
Size the decisions, not just the total survey
Calculate the sample required for the smallest group you need to analyze.
Suppose you collect 400 responses and plan to compare four regions. If responses split evenly, each regional estimate has about 100 observations, not 400. Its margin of error will be much wider than the headline result.
The same issue applies to customer tiers, age groups, product plans, and experimental variants. Plan quotas or oversampling before fieldwork if a subgroup decision matters. Do not discover after collection that the segment you promised to compare has 17 responses.
Also separate estimation from testing. The formula in this guide sizes a survey to estimate a proportion within a target margin. Comparing two groups, detecting a change over time, or proving an experiment effect requires assumptions about effect size, statistical power, and the analysis method. A basic sample-size calculator for one proportion does not answer those questions.
A practical survey planning sequence
- Define the population and the decision the survey will support.
- Choose the confidence level and maximum acceptable margin of error.
- Calculate the required completed responses.
- Adjust for a known finite population when the sample is drawn without replacement.
- Check whether each subgroup will have enough responses for the planned analysis.
- Divide the completion target by a realistic response-rate estimate.
- Document the sampling method, invitation rules, exclusions, and interval method.
- Monitor response and completion while the survey is open.
Start with the Sample Size Calculator, then check the likely precision with the Margin of Error Calculator. Once results arrive, use the Confidence Interval Calculator for an observed percentage and the Response Rate Calculator for participation.
When the numbers are ready for a team decision, Pikli can run the review with live polls, rankings, and Q&A. Start a free Pikli room and turn the result into a next step.
Free to use on Pikli
Calculate your survey sample size
Set confidence, margin of error, and population to get a planning target in seconds.
Ready to discuss the result with your team? Start free with Pikli .
Continue exploring
Related guides
Go deeper with practical articles selected from the same topic cluster.
Survey Response Rate vs Completion Rate
Compare survey response rate and completion rate, calculate both with the right denominators, diagnose drop-off, and report the funnel clearly.
Read article → 02How to Analyze Likert Scale Data
Analyze 5-point or 7-point Likert data with distributions, medians, means, top-box scores, reverse coding, reliability checks, and clear reporting.
Read article → 03A/B Test Statistical Significance Explained
Learn how A/B test significance works for conversion rates, including absolute and relative lift, p-values, confidence levels, sample size, and common mistakes.
Read article → 04NPS vs CSAT vs CES: Which Metric Should You Use?
Compare NPS, CSAT, and CES formulas, timing, use cases, and limitations. Learn which customer experience metric fits each feedback moment.
Read article →